
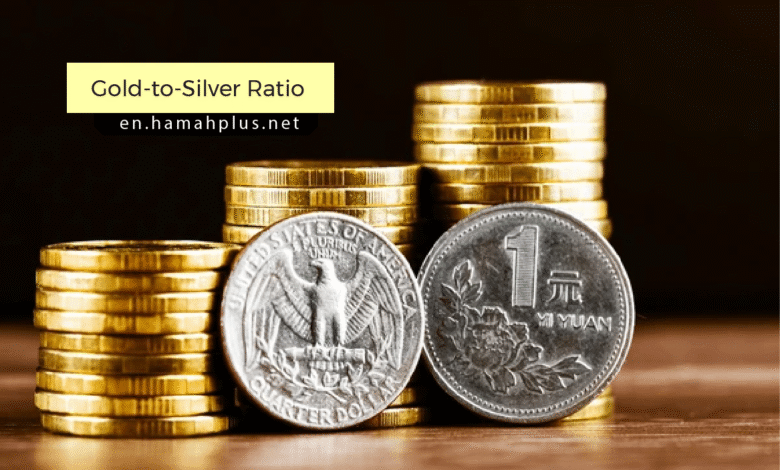
Understanding the Gold-to-Silver Ratio: A Key Investor Metric for Smarter Precious Metals Decisions
Written by: Marcus H. Sterling, CFA
Introduction: The One Metric That Changed How I Look at Precious Metals
If you’ve ever stood in front of a precious metals dealer—or clicked through an online investment platform—wondering whether to buy gold or silver, you’re not alone. I remember that exact feeling back in 2008 during the financial crisis. Gold was soaring. Silver was volatile. And I had no idea which was the “smarter” buy.
Then a mentor introduced me to a single number that transformed my entire approach: the gold-to-silver ratio.
This isn’t some obscure academic metric. It’s a practical, centuries-old tool that professional traders and serious investors use every single day to make more informed decisions about precious metals. And here’s the best part: you don’t need a finance degree to understand it or use it effectively.
In this guide, I’m going to walk you through exactly what the gold-to-silver ratio is, why it matters more than most beginners realize, and—most importantly—how you can use it to avoid costly mistakes and spot genuine opportunities in the precious metals market.
Whether you’re looking to diversify your portfolio, hedge against inflation, or simply understand what the “smart money” is watching, this ratio is one of the most valuable tools you can learn.
Let’s dive in.
Section 1: What Is the Gold-to-Silver Ratio? (Definition and Basic Calculation)
The Simple Definition
The gold-to-silver ratio is exactly what it sounds like: the number of ounces of silver it takes to buy one ounce of gold.
That’s it. Really.
The Basic Calculation
Here’s the formula:
Gold-to-Silver Ratio = Price of One Ounce of Gold ÷ Price of One Ounce of Silver
Real-World Example:
Let’s say:
- Gold is trading at $2,000 per ounce
- Silver is trading at $25 per ounce
The ratio would be: $2,000 ÷ $25 = 80
This means it takes 80 ounces of silver to equal the value of 1 ounce of gold.
Where to Find Current Ratio Data
You don’t have to calculate this yourself. Multiple reputable sources track this ratio in real-time:
- Kitco – One of the most trusted sources for live precious metals prices and the current gold-to-silver ratio
- TradingView – Offers interactive charts showing historical ratio trends
- Bloomberg – Professional-grade financial data including precious metals ratios
In my experience, checking Kitco first thing in the morning has become as routine as checking my email. It’s free, accurate, and updated continuously throughout trading hours.
Why This Number Exists
The ratio exists because gold and silver, while both precious metals, serve different roles in the global economy:
- Gold is primarily seen as a store of value and monetary reserve
- Silver is both an industrial metal (used in electronics, solar panels, medical devices) and a monetary metal
This dual nature of silver creates price dynamics that differ from gold—and that’s precisely what makes the ratio so revealing.
Section 2: Why the Gold-to-Silver Ratio Matters to Investors (Historical Context and Significance)
A Metric With Centuries of History
The most common mistake I see beginners make is thinking the gold-to-silver ratio is some modern Wall Street invention. In reality, this relationship has been tracked for thousands of years.
Historical Context:
- Ancient Rome (circa 12:1 ratio): Roman law actually fixed the ratio at approximately 12 ounces of silver to 1 ounce of gold
- U.S. Bimetallic Standard (15.5:1 ratio): In 1792, the U.S. Coinage Act established a legal ratio of 15:1 for American currency
- 20th Century Average (approximately 47:1): According to data from the U.S. Geological Survey, the historical average throughout the 1900s hovered around 47:1
- Modern Era (highly variable): The ratio has swung dramatically, from lows near 30:1 to highs above 120:1 during extreme market stress
You can explore comprehensive historical mining and production data at the U.S. Geological Survey, which tracks both gold and silver supply fundamentals.
Why Investors Watch This Ratio Like Hawks
The ratio matters because it reveals relative value between the two metals. Here’s what personally worked for me when I started paying attention to this metric:
1. Spotting Undervalued Opportunities
When the ratio is historically high (say, above 80), it suggests silver is cheap relative to gold. When it’s historically low (below 40), gold appears relatively cheap compared to silver.
2. Portfolio Rebalancing Signal
The World Gold Council—the market development organization for the gold industry—regularly publishes research on precious metals portfolio strategies. Understanding the ratio helps you maintain optimal allocation between gold and silver holdings.
3. Market Sentiment Indicator
Extreme ratio readings often signal fear or complacency in precious metals markets:
- High ratios (100+) often occur during financial crises when investors flee to gold’s perceived safety
- Low ratios (below 50) typically appear during industrial booms when silver demand surges
According to market data from Reuters, during the March 2020 COVID-19 panic, the ratio spiked to an extraordinary 125:1—the highest level in modern history. This signaled extreme stress in precious metals markets.
The “Fair Value” Question
There’s no universally “correct” ratio. However, examining both:
- Geological abundance (silver is roughly 15-17 times more abundant in the Earth’s crust than gold, per USGS data)
- Modern mining ratios (approximately 8-9 ounces of silver mined for every ounce of gold)
…suggests that ratios consistently above 80 may indicate silver is relatively undervalued, while ratios below 40 may suggest gold is relatively cheap.
The London Bullion Market Association (LBMA)—the primary trade association for the global wholesale precious metals market—provides extensive market research that contextualizes these relationships.
Section 3: How to Interpret the Ratio (High vs. Low Ratios and What They Signal)
Understanding High Ratios (Above 80:1)
What It Means:
A high ratio indicates that gold is expensive relative to silver—or conversely, that silver is cheap relative to gold.
Historical Examples:
- 2020 Pandemic Panic: Ratio spiked to 125:1 as investors rushed into gold
- 2008 Financial Crisis: Ratio exceeded 80:1 as credit markets froze
What It Typically Signals:
✓ Flight to safety: Investors prefer gold’s perceived stability
✓ Economic uncertainty: Fear drives gold demand disproportionately
✓ Potential silver opportunity: Silver may be undervalued relative to historical norms
✓ Industrial demand weakness: Silver’s industrial uses may be suffering
In My Experience:
When I see the ratio climb above 85, I start paying very close attention to silver. It doesn’t mean I immediately buy—but it puts silver on my watchlist as potentially undervalued.
Understanding Low Ratios (Below 50:1)
What It Means:
A low ratio suggests silver is expensive relative to gold—or that gold is relatively cheap.
Historical Examples:
- 1980 Hunt Brothers Silver Manipulation: Ratio briefly dropped to 15:1 during artificial silver spike
- 2011 Commodity Supercycle Peak: Ratio touched 32:1 as silver soared to nearly $50/oz
What It Typically Signals:
✓ Industrial demand surge: Silver’s industrial applications are thriving
✓ Inflationary environment: Both metals rising, but silver outpacing gold
✓ Speculative enthusiasm: Retail investors often chase silver’s higher volatility
✓ Potential gold opportunity: Gold may be undervalued relative to silver
Cautionary Note:
What personally worked for me was learning not to fight extremely low ratios. When silver gets hot, it can stay hot longer than you might expect—particularly if industrial demand (solar panels, electric vehicles, electronics) is genuinely strong.
The World Gold Council regularly publishes reports on demand dynamics that can help you understand whether a ratio move is fundamentally justified or speculative.
The “Sweet Spot” Range (50-80:1)
Historically, the ratio has spent much of its time between 50:1 and 80:1 in modern markets. Within this range, neither metal appears dramatically over- or undervalued relative to the other.
What This Means for You:
- This range represents “normal” market conditions
- Extreme moves outside this range (especially sustained moves) warrant attention
- Mean reversion—the tendency for the ratio to return toward historical averages—is a powerful force
Key Interpretation Principle: Context Matters
The ratio doesn’t operate in a vacuum. You must consider:
- Macroeconomic environment (inflation, interest rates, currency strength)
- Supply fundamentals (mining production, recycling, stockpiles)
- Demand drivers (jewelry, investment, industrial applications)
- Market sentiment (fear/greed, speculation levels)
Resources like Bloomberg and specialized precious metals research from the LBMA provide the context you need to interpret ratio movements correctly.
Section 4: Practical Ways to Use the Ratio in Your Investment Strategy (Trading Opportunities and Portfolio Balance)
Strategy #1: Ratio Trading (For Active Investors)
The Concept:
Buy the “cheap” metal when the ratio reaches extremes, then swap back when it normalizes.
Example Trade Sequence:
- Ratio at 100:1 (March 2020): Silver appears extremely undervalued
- Action: Convert some gold holdings to silver, or allocate new capital to silver
- Ratio returns to 70:1 (August 2020): Silver has outperformed
- Action: Convert some silver profits back to gold or take gains
Critical Requirements:
- Access to low-cost buying/selling (dealer spreads and transaction costs matter enormously)
- Patience to wait for genuine extremes
- Emotional discipline to act when ratios reach uncomfortable extremes
Where to Execute:
If you’re considering ratio trading with precious metals ETFs, examine:
- iShares Gold Trust (IAU) for gold exposure
- iShares Silver Trust (SLV) for silver exposure
- SPDR Gold Shares (GLD) as the largest and most liquid gold ETF
Important Risk Disclosure:
Always review the prospectus and risk factors. The U.S. Securities and Exchange Commission (SEC) requires that all ETFs provide detailed risk disclosures—read them carefully before investing.
Strategy #2: Portfolio Allocation Adjustment (For Long-Term Investors)
The Concept:
Use the ratio to maintain optimal balance in your precious metals allocation.
Example Allocation Framework:
| Ratio Level | Gold Allocation | Silver Allocation |
|---|---|---|
| Below 50:1 | 70-80% | 20-30% |
| 50-80:1 | 60-70% | 30-40% |
| Above 80:1 | 50-60% | 40-50% |
My Personal Approach:
I maintain a core precious metals position (approximately 10-15% of my total portfolio) and adjust the internal split between gold and silver based on the ratio.
When the ratio is “normal” (60-70), I hold about 65% gold and 35% silver. At extremes, I might shift to 50/50 or 75/25.
Why This Works:
- You’re systematically buying strength and selling weakness
- You maintain precious metals exposure regardless of ratio level
- You avoid emotional decision-making
- Transaction costs are minimized (you’re only adjusting at extremes)
Strategy #3: Dollar-Cost Averaging with Ratio Awareness
The Concept:
If you’re building a precious metals position gradually, let the ratio guide which metal receives your monthly investment.
Example Monthly Investment Plan:
- Budget: $500/month for precious metals
- Ratio above 85: Allocate $350 to silver, $150 to gold
- Ratio 50-85: Allocate $300 to silver, $200 to gold
- Ratio below 50: Allocate $150 to silver, $350 to gold
Benefits:
✓ Builds position consistently
✓ Captures relative value automatically
✓ Removes emotional guesswork
✓ Works with small budgets
Strategy #4: Using the Ratio as a Risk/Opportunity Filter
Even if you’re not actively trading, the ratio provides valuable context:
High Ratio (80+) Signals:
- ⚠️ Risk: Economic stress or crisis conditions may be present
- ✓ Opportunity: Silver may offer better relative value for new purchases
- ✓ Context: Review why the ratio is elevated—justified or temporary?
Low Ratio (Below 50) Signals:
- ⚠️ Risk: Silver may be overheated or in a speculative bubble
- ✓ Opportunity: Gold may offer better relative value
- ✓ Context: Is industrial demand genuinely strong, or is this speculation?
Tools and Resources for Implementation
Tracking and Charting:
- TradingView – Free charts with historical ratio data
- Kitco – Real-time ratio updates and historical graphs
Market Research and Context:
- World Gold Council – Quarterly demand reports and investment research
- LBMA – Market standards, pricing, and professional insights
Investment Vehicles:
- Physical metals through reputable dealers
- ETFs like those from iShares or SPDR
- Precious metals IRAs (consult with a qualified financial advisor)
The Reality Check
What personally worked for me was treating the ratio as one input among many—never as a crystal ball.
The ratio doesn’t predict the future price of gold or silver. It only reveals their relative relationship. Both metals can fall while the ratio stays constant. Both can rise while the ratio changes dramatically.
Always consider your:
- Overall financial goals
- Risk tolerance
- Investment timeline
- Total portfolio context
Section 5: Common Mistakes Beginners Make When Using the Gold-to-Silver Ratio
After coaching dozens of new precious metals investors over the years, I’ve seen the same errors repeated again and again. Here are the big ones—and how to avoid them.
Mistake #1: Treating the Ratio as a Market Timing Tool
The Error:
Believing that a high ratio means silver will definitely outperform soon, or that a low ratio guarantees gold will surge.
The Reality:
The ratio can stay at extremes far longer than beginners expect. In 2020, the ratio stayed above 100 for months. In 2011, it stayed below 40 for an extended period.
The Fix:
- Use the ratio to identify potential value, not guaranteed outcomes
- Wait for additional confirming signals (technical indicators, fundamental developments)
- Be patient—mean reversion happens, but on its own timeline
In My Experience:
The most expensive lesson I learned was selling silver too early in 2010 when the ratio dropped to 50. I thought it was “too low,” but it continued falling to 32 over the next year as silver rallied hard. Don’t fight momentum just because of ratio levels.
Mistake #2: Ignoring Transaction Costs and Spreads
The Error:
Focusing solely on the ratio without considering the real-world costs of buying and selling precious metals.
The Reality:
Physical metals dealers typically charge:
- 2-5% premiums over spot price when you buy
- 2-5% below spot when you sell (the “bid-ask spread”)
This means you might need a 10%+ move just to break even on a round-trip trade.
The Fix:
- Calculate your total transaction costs before making ratio trades
- Use lower-cost vehicles (ETFs) if you plan to trade actively
- For physical metals, plan to hold long-term to justify transaction costs
- Only make ratio-based swaps at genuine extremes (not minor fluctuations)
Resource:
Review the fee structures and expense ratios of precious metals ETFs at iShares and compare them to physical purchase costs.
Mistake #3: Using Too Much Leverage or Borrowed Money
The Error:
Getting so excited about an extreme ratio reading that you borrow money, use margin, or overextend your finances to make a “can’t miss” trade.
The Reality:
Precious metals are volatile. Silver, in particular, can move 5-10% in a single day. Leverage amplifies losses as much as gains.
The Fix:
- Only invest money you can afford to set aside for years
- Never use borrowed money for precious metals speculation
- Avoid leveraged ETFs (2x or 3x products) unless you’re an experienced trader who understands decay dynamics
- Keep precious metals allocation to a reasonable percentage of your total portfolio (typically 5-15%)
Official Risk Warning:
The SEC provides extensive investor education about the risks of leveraged and inverse ETFs. Read these carefully before considering any leveraged precious metals products.
Mistake #4: Forgetting About Tax Implications
The Error:
Trading frequently between gold and silver without understanding the tax consequences.
The Reality:
In the United States, physical precious metals are classified as “collectibles” and subject to a maximum 28% long-term capital gains tax rate (higher than the 15-20% rate on stocks).
Frequent trading can also trigger short-term capital gains taxed at ordinary income rates (potentially 37%+).
The Fix:
- Consult with a qualified tax professional before implementing ratio trading strategies
- Consider holding precious metals in tax-advantaged accounts (like certain IRAs)
- Keep meticulous records of all purchases, sales, and exchanges
- Understand that swapping gold for silver (or vice versa) is a taxable event
Resource:
The IRS provides guidance on precious metals taxation—or better yet, work with a CPA familiar with precious metals.
Mistake #5: Analyzing the Ratio in Isolation
The Error:
Making investment decisions based solely on the gold-to-silver ratio without considering broader market context.
The Reality:
The ratio is one indicator among many. It should be evaluated alongside:
- Dollar strength/weakness (precious metals are priced in USD)
- Real interest rates (negative real rates typically favor precious metals)
- Inflation expectations (both metals serve as inflation hedges)
- Industrial demand trends (particularly for silver)
- Central bank policy (gold buying by central banks, monetary policy)
- Geopolitical events (crisis situations affect both metals)
The Fix:
- Build a complete analytical framework
- Follow reputable market research from sources like the World Gold Council
- Stay informed through financial news services like Bloomberg and Reuters
- Consider working with a financial advisor who understands precious metals
Mistake #6: Expecting Precision
The Error:
Believing there’s a “perfect” ratio level where you should always buy or sell.
The Reality:
Markets are complex, dynamic systems influenced by countless variables. The ratio is a guideline, not a formula.
The Fix:
Think in ranges rather than specific numbers:
- “I get interested in silver when the ratio exceeds 85”
- “I consider gold potentially undervalued below 45”
- Use the ratio as a probability indicator, not a guarantee
What Personally Worked for Me:
I stopped trying to “optimize” every decision and started using broader rules: “Above 90, I’m buying silver; below 45, I’m buying gold.” This removed paralysis and let me act on genuine extremes without obsessing over whether I was getting the absolute perfect entry.
Conclusion: Making the Gold-to-Silver Ratio Work for You
The gold-to-silver ratio is deceptively simple—a single number that represents thousands of years of monetary history, complex market dynamics, and genuine investment opportunity.
But here’s what I’ve learned after 15+ years of using this metric: it’s not a magic formula. It won’t tell you exactly when to buy or sell. It won’t eliminate risk or guarantee profits.
What it will do—if you use it thoughtfully, patiently, and as part of a broader investment framework—is help you:
✓ Identify relative value between two important portfolio diversifiers
✓ Avoid costly mistakes like chasing whichever metal is currently surging
✓ Make more informed allocation decisions within your precious metals holdings
✓ Understand market dynamics that escape most casual investors
✓ Build discipline into your precious metals strategy
Your Next Steps
1. Start Tracking the Ratio
Bookmark Kitco or TradingView and check the current ratio weekly. Watch how it moves. Notice what market conditions correlate with ratio changes.
2. Educate Yourself Continuously
Explore the extensive research available at:
- World Gold Council for gold market insights
- LBMA for professional market standards and data
- U.S. Geological Survey for supply fundamentals
3. Develop Your Strategy
Decide how the ratio fits into your investment approach:
- Are you a long-term holder adjusting allocation periodically?
- An active trader looking for ratio extremes?
- A dollar-cost averager using the ratio to guide monthly purchases?
4. Start Small and Learn
Don’t commit your entire precious metals budget on your first ratio-based decision. Test your strategy with a small position, learn from the experience, and scale gradually.
5. Seek Professional Guidance
If you’re investing significant capital, consult with a qualified financial advisor who understands precious metals. Review all investment disclosures through official sources like the SEC.
Final Thought
The gold-to-silver ratio has survived millennia because it reveals something fundamental: the relative value of two of humanity’s oldest and most enduring forms of wealth.
You don’t need to be a professional trader to benefit from this ancient insight. You just need patience, discipline, and a commitment to continuous learning.
The ratio is always there, quietly telling its story about fear and confidence, scarcity and abundance, value and opportunity.
Are you listening?
FAQ Section
1. What is a “normal” gold-to-silver ratio?
There’s no single “normal” ratio—it depends on the time period you examine.
Historical Context:
- Ancient to medieval times: Ratios typically ranged from 10:1 to 15:1
- 20th century average: Approximately 47:1 according to USGS data
- Modern era (1990-present): Usually fluctuates between 50:1 and 80:1
- Extreme readings: Has ranged from below 20:1 (1980) to above 120:1 (2020)
Practical Answer:
In today’s market, most analysts consider 50:1 to 80:1 as the “normal” range. Moves significantly outside this range warrant attention as potential value opportunities.
The World Gold Council regularly publishes research examining historical ratio trends that can provide additional context.
2. Can I use this ratio to time the market?
Short answer: Not reliably—and trying to do so is one of the most common mistakes beginners make.
Long answer:
The ratio identifies relative value, not timing. It tells you whether gold is expensive compared to silver (or vice versa), but it doesn’t tell you:
- When the ratio will revert to historical norms
- Whether both metals will rise or fall
- What external events will drive the next move
What the ratio CAN do:
✓ Help you identify when one metal is extremely over- or under-valued relative to the other
✓ Guide allocation decisions within your precious metals holdings
✓ Provide context for portfolio rebalancing
✓ Suggest patience (avoid chasing whichever metal just surged)
In My Experience:
The most successful investors use the ratio as a probability indicator (“silver looks interesting here”) combined with other technical and fundamental analysis—never as a standalone timing signal.
Track the ratio using tools from TradingView or Kitco, but always consider broader market conditions from sources like Bloomberg and Reuters.
3. Is the ratio more useful for traders or long-term investors?
It’s valuable for both—but used differently.
For Active Traders:
- The ratio can identify tactical opportunities to swap between gold and silver
- Requires low transaction costs (ETFs like those from iShares or SPDR work better than physical metals)
- Demands discipline to act on genuine extremes, not minor fluctuations
- Works best when combined with technical analysis and momentum indicators
For Long-Term Investors:
- The ratio guides allocation balance within a precious metals portfolio
- Helps avoid emotional decisions (chasing recent performance)
- Supports periodic rebalancing at extreme readings
- Encourages contrarian thinking (buying what’s relatively cheap)
My Personal Take:
I actually think the ratio is more valuable for long-term investors precisely because they don’t try to optimize every short-term move. Using the ratio to rebalance once or twice a year at extremes minimizes transaction costs while capturing relative value over time.
4. Which metal should I buy when the ratio is at “normal” levels?
The honest answer: When the ratio is in the normal range (50-80), neither metal is obviously cheap relative to the other, so your decision should be based on other factors.
Consider Instead:
Choose Gold if you prioritize:
- ✓ Lower volatility and more stable prices
- ✓ Better liquidity (easier to sell quickly)
- ✓ Primary focus on wealth preservation
- ✓ Central bank buying trends (tracked by the World Gold Council)
- ✓ Portfolio insurance against systemic financial risk
Choose Silver if you value:
- ✓ Higher growth potential (more price volatility)
- ✓ Dual industrial/monetary demand characteristics
- ✓ Lower entry cost per ounce (easier to start small)
- ✓ Potential leverage to industrial economic growth
- ✓ More speculative risk/reward profile
Balanced Approach:
Many investors (myself included) simply hold both metals when the ratio is normal—something like 60-70% gold and 30-40% silver. This captures the benefits of both while avoiding the need to “pick a winner.”
Adjust the mix as the ratio moves to extremes, always considering your overall portfolio goals and risk tolerance.
Important Reminder:
Before investing in precious metals ETFs, always review the official prospectus and risk factors available at iShares, SPDR, or through the SEC.
5. How often should I check the gold-to-silver ratio?
The frequency depends on your investment approach and temperament.
Daily Checking (Active Traders):
- Appropriate if you’re actively trading ratio extremes
- Use real-time data from Kitco or TradingView
- Risk: Can lead to over-trading and excessive transaction costs
- Requires significant time commitment and emotional discipline
Weekly Checking (Tactical Investors):
- Good balance for those who want to stay informed without obsessing
- Sufficient to identify developing trends toward extremes
- Allows time to research context before making moves
- My personal preference for most of my investing career
Monthly or Quarterly Checking (Long-Term Holders):
- Perfectly adequate if you’re a buy-and-hold investor
- Focus on significant moves outside normal range (below 50 or above 85)
- Minimizes noise and emotional reaction to minor fluctuations
- Pairs well with periodic portfolio rebalancing schedule
What Personally Worked for Me:
Early in my career, I checked daily and made too many small adjustments that cost me in transaction fees and taxes. Now I review the ratio weekly but only act when it reaches genuine extremes (below 45 or above 90) AND other fundamental/technical factors confirm the opportunity.
Golden Rule:
The more frequently you check, the more discipline you need to avoid impulsive decisions. Set clear criteria for when you’ll act, and don’t deviate from your plan based on minor ratio movements.
Stay Informed:
Complement your ratio monitoring with periodic review of market research from the LBMA, World Gold Council, and financial news from Bloomberg or Reuters to understand the broader context driving ratio changes.
Disclaimer: This article is for educational and informational purposes only and should not be considered personalized investment advice. Precious metals investing involves significant risks, including the potential for substantial losses. Past performance does not guarantee future results. Always conduct your own due diligence, read official prospectuses and risk disclosures from providers like the SEC, and consult with a qualified financial advisor before making investment decisions. The author may hold positions in precious metals but has no financial relationship with any companies mentioned in this article.
About the Author:
Marcus H. Sterling, CFA, is a precious metals analyst and commodity investment strategist with over 15 years of experience in portfolio management, specializing in gold, silver, and alternative assets. He has advised individual investors, family offices, and institutional clients on precious metals allocation strategies and has been featured in various financial publications for his work on commodity market analysis.